Find the right interface
The bus tools use a KNXnet/IP interface. KNX Atlas can search for interfaces in Bus Settings. If it finds more than one, choose the one you need; host and port fields also allow manual configuration.
The app can display tunnel slots reported by the interface and suggest a usable slot. Occupied slots or slots unsuitable because of a conflict are shown accordingly. Manual configuration remains relevant for interfaces that do not provide this information.
Observe without sending values from the monitor
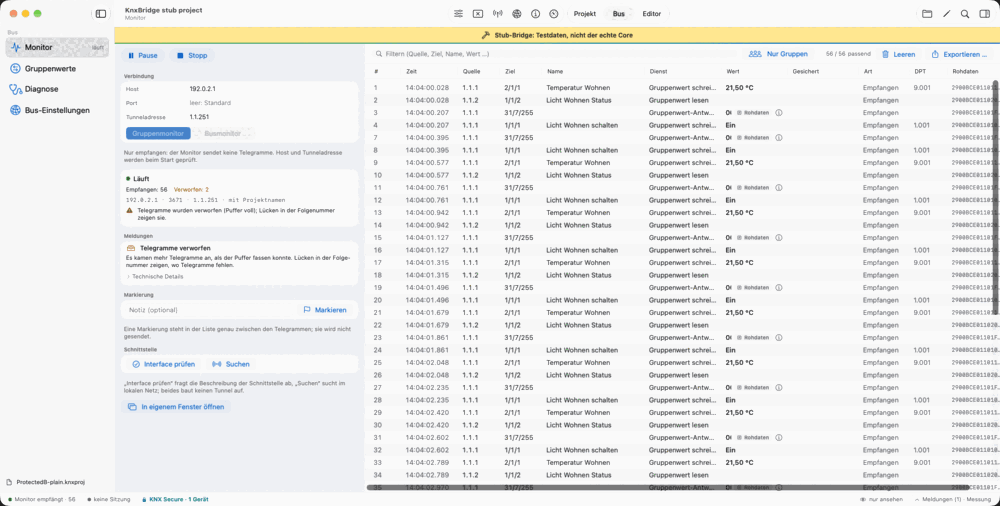
The monitor offers group and bus monitor modes. You can search and filter the live list. With a project open, stored group address names help you interpret the traffic; an entry point without a project is also available.
The monitor receives telegrams. Its controls do not send group values. A separate Group Values tool handles targeted reads and writes.
- Start and stop
- Deliberately open and close the monitor connection.
- Pause the display
- Hold the presentation to examine entries more closely. Reception continues while paused.
- See the connection state
- Messages indicate a closed connection or dropped entries.
Find important moments again
Add a personal note to mark a position in the telegram stream. This helps, for example, when pressing a wall button and relating the response to a moment in time. The marker appears at the corresponding position in the stream.
CSV export includes the displayed columns for later analysis. You can include markers in the export. You explicitly choose whether project information, such as group address names, is included.
Secured telegrams have additional export rules: decrypted content is included only when project contents are explicitly enabled. This lets you distinguish a technical export from a file containing meaningful project information.
Check reachability selectively
Start a reachability check for a single device from its detail view. The topology also lets you check devices on a line; one operation covers at most 64 devices. Additional entries are not silently presented as having been checked.
Results include reachability, mask version and the detected programming mode where available. A missing response stays visible as such. The tool reads the state; it does not put a device into programming mode.
These details help narrow down connection problems. They are not a complete electrical inspection and do not automatically prove that every function of a reachable device is working correctly.
When several tools work at the same time
The group monitor and group values can run in parallel if the interface provides the separate tunnels they need. The number of available tunnel slots depends on the interface and their current use.
If the interface refuses a second tunnel, KNX Atlas offers to switch to one connection at a time. The running monitor stops only after you choose that option. If even the released slot cannot be used, the app displays the rejection.